Ein Plot sagt mehr als 1000 Worte
- Grafisch gestützte Datenanalyse ist toll
- Gute Plots können zu einem besseren Verständnis beitragen
- Einen Plot zu generieren geht schnell
- Einen guten Plot zu machen kann sehr lange dauern
- Mit R Plots zu generieren macht Spaß
- Mit R erstellte Plots haben hohe Qualität
- Fast jeder Plottyp wird von R unterstützt
- R kennt eine große Menge an Exportformaten für Grafiken
Plot ist nicht gleich Plot
- Bereits das base Package bringt eine große Menge von Plot Funktionen mit
- Das lattice Packet erweitert dessen Funktionalität
- Eine weit über diese Einführung hinausgehende Übersicht findet sich in Murrell, P (2006): R Graphics.
Task View zu Thema Graphiken

Datensatz
library(mlmRev)
data(Chem97)
- [lea] Local Education Authority - a factor
- [school] School identifier - a factor
- [student] Student identifier - a factor
- [score] Point score on A-level Chemistry in 1997
- [gender] Student’s gender
- [age] Age in month, centred at 222 months or 18.5 years
- [gcsescore] Average GCSE score of individual.
- [gcsecnt] Average GCSE score of individual, centered at mean.
Histogramm - Die Funktion hist()
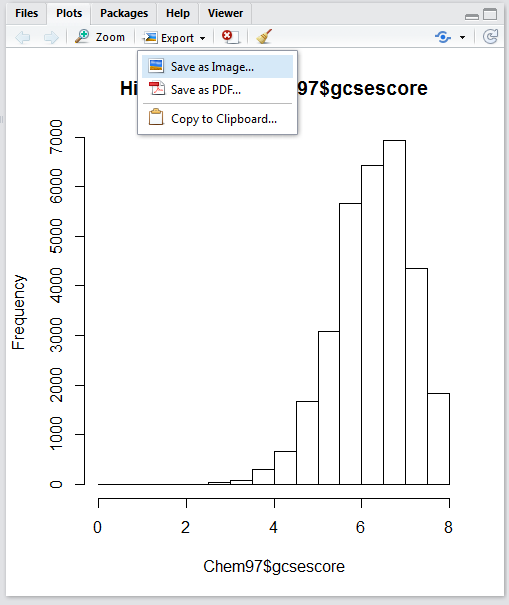
Wir erstellen ein Histogramm der Variable gcsescore:
?hist

hist(Chem97$gcsescore)

Graphik speichern
- Mit dem button Export in Rstudio kann man die Grafik speichern.
Befehl um Graphik zu speichern
- Alternativ auch bspw. mit den Befehlen
png,pdfoderjpeg
png("Histogramm.png")
hist(Chem97$gcsescore)
dev.off()
Histogramme
- Die Funktion
hist()plottet ein Histogramm der Daten - Der Funktion muss mindestens ein Beobachtungsvektor übergeben werden
hist()hat noch sehr viel mehr Argumente, die alle (sinnvolle) default values haben
| Argument | Bedeutung | Beispiel |
|---|---|---|
| main | Überschrift | main="Hallo Welt" |
| xlab | x-Achsenbeschriftung | xlab="x-Werte" |
| ylab | y-Achsenbeschriftung | ylab="y-Werte" |
| col | Farbe | col="blue" |
Histogramm
hist(Chem97$gcsescore,col="blue",
     main="Hallo Welt",ylab="y-Werte", xlab="x-Werte")

Weitere Argumente:
?plot
# oder
?par
Barplot
- Die Funktion
barplot()erzeugt aus einer Häufigkeitstabelle einen Barplot - Ist das übergebene Tabellen-Objekt zweidimensional wird ein bedingter Barplot erstellt
tabScore <- table(Chem97$score)

barplot(tabScore)
Barplots und barcharts
barplot(tabScore)

Mehr Farben:
barplot(tabScore,col=rgb(0,0,1))

Grüne Farbe
barplot(tabScore,col=rgb(0,1,0))

Rote Farbe
barplot(tabScore,col=rgb(1,0,0))

Transparent
barplot(tabScore,col=rgb(1,0,0,.3))

Scatterplots
- Ein einfacher two-way Scatterplot kann mit der Funktion plot() erstellt werden
- plot() muss mindestens ein x und ein y Beobachtungsvektor übergeben werden
- Um die Farbe der Plot-Symbole anzupassen gibt es die Option col (Farbe als character oder numerisch)
- Die Plot-Symbole selbst können mit pch (plotting character) angepasst werden (character oder numerisch)
- Die Achenbeschriftungen (labels) werden mit xlab und ylab definiert
Beispieldaten für Scatterplot
x <- runif(100)
y <- runif(100)
Einfacher Scatterplot
plot(x,y)

Einfacher Scatterplot II
plot(x,y,pch=20)

Einfacher Scatterplot III
plot(x,y,pch=20)

Boxplot
- Einen einfachen Boxplot erstellt man mit
boxplot() - Auch
boxplot()muss mindestens ein Beobachtungsvektor übergeben werden
?boxplot
Horizontaler Boxplot
boxplot(Chem97$gcsescore,
horizontal=TRUE)

Gruppierte Boxplots
- Ein sehr einfacher Weg, einen ersten Eindruck über bedingte Verteilungen zu bekommen ist über sog. Gruppierte notched Boxplots
- Dazu muss der Funktion
boxplot()ein sog. Formel-Objekt übergeben werden - Die bedingende Variable steht dabei auf der rechten Seite einer Tilde
Beispiel grupierter Boxplot
boxplot(Chem97$gcsescore~Chem97$gender)

Alternativen zu Boxplot
Violinplot
- Baut auf Boxplot auf
- Zusätzlich Informationen über Dichte der Daten
- Dichte wird über Kernel Methode berechnet.
- weißer Punkt - Median
- Je weiter die Ausdehnung, desto größer ist die Dichte an dieser Stelle.
# Beispieldaten erzeugen
x <- rnorm(100)
y <- rnorm(100)
Die Bibliothek vioplot
library(vioplot)
plot(x, y, xlim=c(-5,5), ylim=c(-5,5))
vioplot(x, col="tomato", horizontal=TRUE, at=-4,
        add=TRUE,lty=2, rectCol="gray")
vioplot(y, col="cyan", horizontal=FALSE, at=-4,
        add=TRUE,lty=2)
vioplot - Das Ergebnis

Alternativen zum Boxplot
library(beanplot)
par(mfrow = c(1,2))
boxplot(count~spray,data=InsectSprays,col="blue")
beanplot(count~spray,data=InsectSprays,col="orange")

CMYK Farbschema
pdf("test.cmyk.pdf", colormodel='cmyk')
pie(1:10, col=1:10)
dev.off()
Aufgabe - einfache Grafiken
- Laden Sie den Datensatz
VADeathsund erzeugen Sie den folgenden plot:
